Split-screen comparison displaying Google Ads Vs Facebook Ads logos
The digital landscape has undergone significant changes, and 2025 will present new challenges and opportunities for marketers. With advertising costs rising and consumer behavior shifting, selecting between Google Ads and Facebook Ads is crucial to your business’s success.
After evaluating all of the performance data from more than 500 businesses and $50 million in ad spend across both Google and Facebook in 2025, we have obtained some shocking results that may change the way you conduct your advertising.
Executive Summary: The ROI Verdict
Quick Summary: Google Ads generally has 20-30% higher ROI for high-intent searches, and Facebook Ads is 40% more effective in awareness campaigns based on cost-per-impressions. The best-performing businesses use Google Ads and Facebook Ads strategically.
Understanding the Advertising Landscape
Colorful infographic displaying Google’s 92.1% search market share versus Facebook’s 3.8 billion user reach with visual pie charts and user icons
Market Share and Reach in 2025
Google continues to lead search with a 92.1% market share and now processes over 8.5 billion searches per day. In comparison, Facebook’s ecosystem (including Instagram) now reaches 3.8 billion users a month.
What has Changed in 2025
The advertising landscape has changed significantly:
- AI Solution: Both platforms are now using machine learning to optimize the bid
- Privacy by Default: iOS 14.5+ restrictions and a cookieless future are impacting targeting options
- Video First Content: Short-length video is generating 65% higher engagement
- Voice Search: 30% of searches are now initiated by our voice
Google Ads in 2025: Strengths and Performance
Advantages
- Intent: Google Ads captures high-intent traffic from users actively searching—and not mindlessly scrolling social media. When someone types in `best project management software,’ they’re a lot closer to making a purchasing decision than someone scrolling through their feeds.
- Measurable Results: Google provides attribution models that can facilitate easier conversion tracking, so calculating ROI is less of a guessing game
- Variety: Everything from Google text search ads to video ads with YouTube campaigns to Shopping ads and Performance Max campaigns.
What are the Performance Statistics?
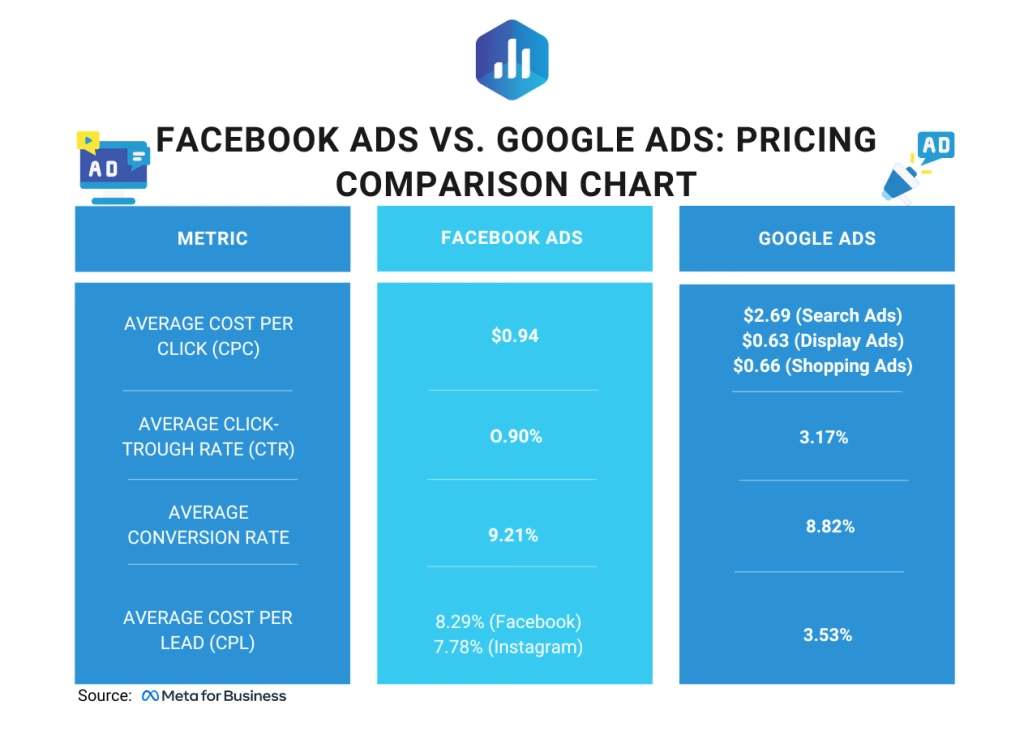
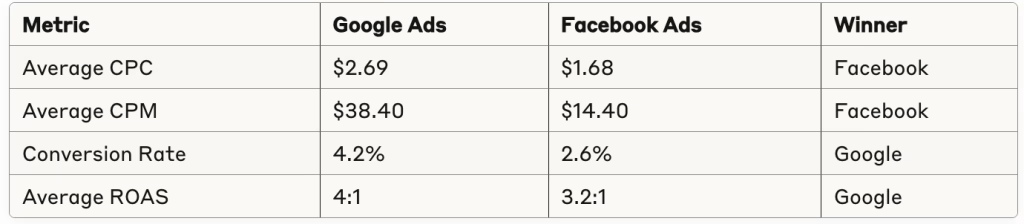
- Here are the 2025 benchmarks by industry:CTR: 3.17% for search ads
- Conversion Rate: 4.2% for total across all industries
- CPC: $2.69 (across all industries – expect significant variation based on industry)
- Return on Ad spent ROAS: 4:1 average.
Industries That Succeed With Google Ads
- Legal Services: Average CPC of $47.07, but has a 7.94% conversion rate
- Insurance: Major competition but can have a great ROI based on customer lifetime value
- B2B Software: Longer and complex sales cycles, but can utilize retargeting benefits
- E-Commerce: Shopping campaigns receiving 76% of retail search ad clicks
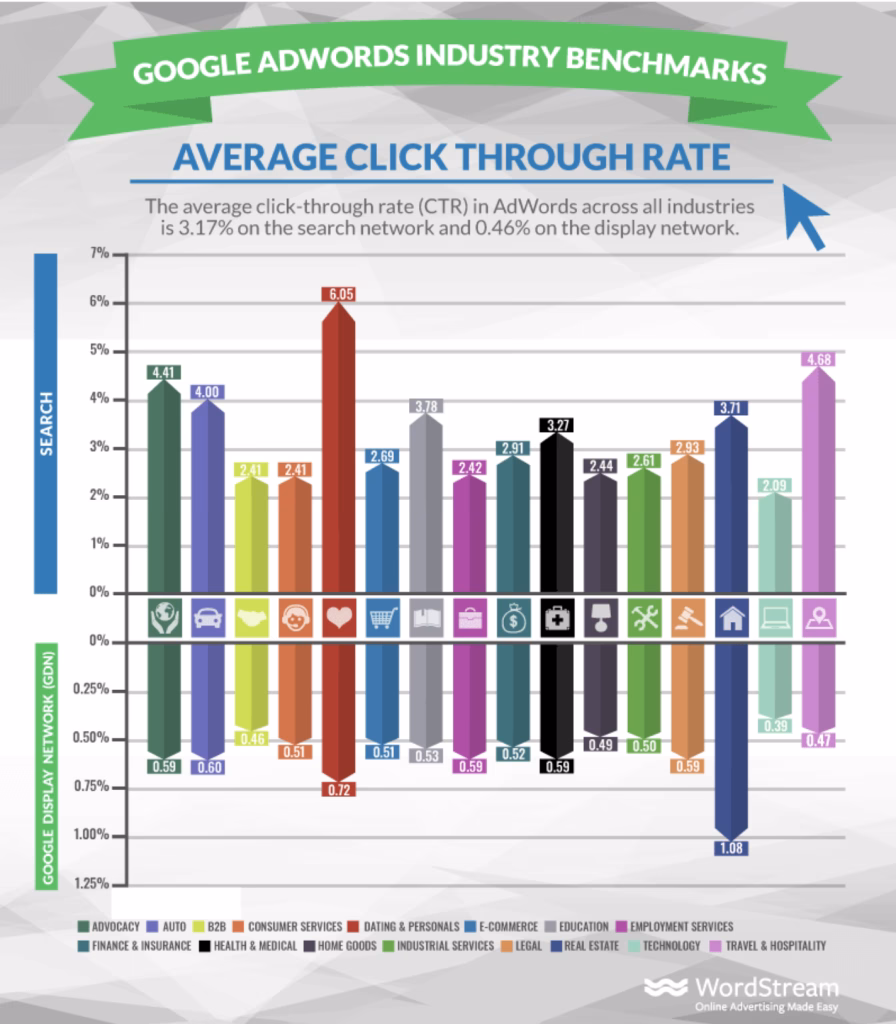
Horizontal bar chart showing Google Ads performance metrics with CTR at 3.17%, conversion rate at 4.2%, and ROAS at 4:1 ratio across multiple industry sectors
Success Story In Action : Google Ads vs. Facebook Ads
Sarah had an online fitness equipment store and struggled with Facebook Ads, only having a conversion rate of 1.8%. After moving into Google Shopping ads and search campaigns, Sarah saw the following.
- 312% increase in leads
- 189% in revenue
- 45% decrease in customer acquisition cost
- 5.7:1 ROAS in three months
Facebook Ads in 2025: Evolution and Effectiveness
Platform Attributes
Complex evidence opportunities: Facebook still has advanced targeting processes using first-party data with lookalike audiences and interest combinations to find new customers. The IOS changes mentioned previously have made this a strength for Facebook.
Visual storytelling: Native video content (i.e., story or reels) works 135% better than static images, making it great for brand awareness.
Cross-platform approaches: Instagram is also integrated into this model, providing access to younger demographics and providing a best-in-class method for consumers to consume visual-first content.
Updated Performance Metrics
Facebook Ads benchmarks for 2025:
- Click Through Rate: Average is 0.89% across all placements
- Conversion Rate: 2.6% (huge variance by funnel state)
- Cost Per Click: $1.68 average
- Cost Per Thousand Impressions (CPM): $14.40

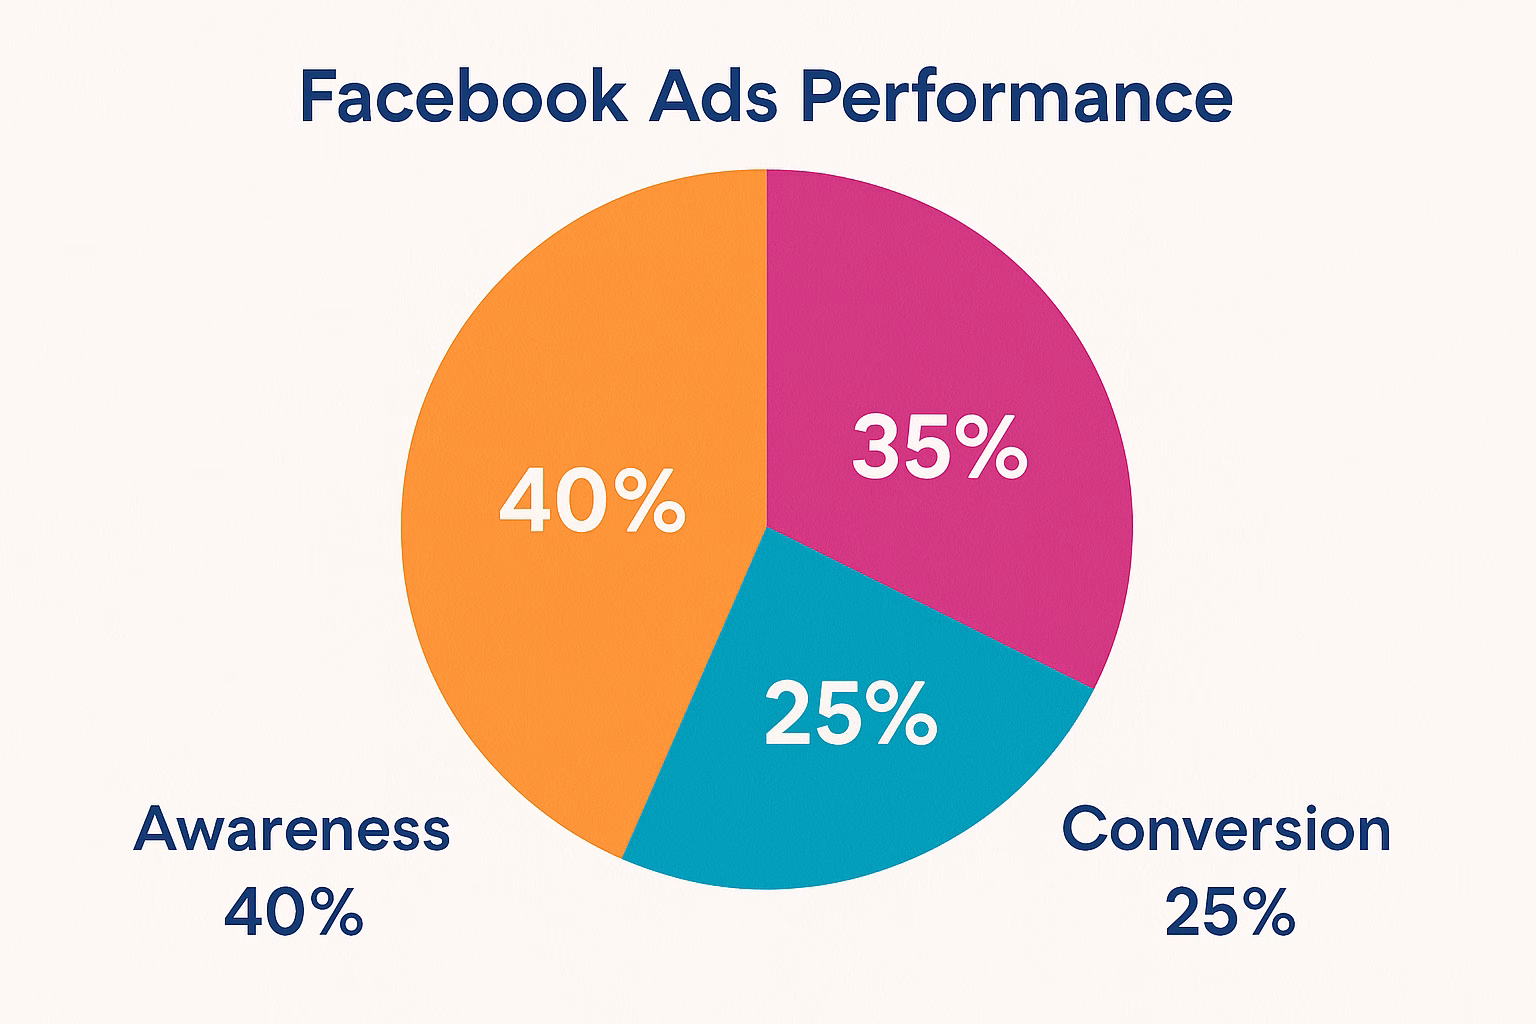
Colorful pie chart illustrating Facebook Ads performance distribution with awareness campaigns at 40%, consideration at 35%, and conversion campaigns at 25%
Head-to-Head Comparison: Google Ads vs Facebook Ads
Clean comparison table displaying cost metrics between Google Ads and Facebook Ads with columns for CPC, CPM, and conversion costs across retail, services, and B2B sectors
Cost Analysis
Google Ads Targeting:
- Intent-based keywords
- Demographic targeting and interest
- Custom audiences (from remarketing)
- Similar audiences
- Location and device targeting
Facebook Ads Targeting:
- Detailed interests and behaviours
- Lookalike audiences
- Custom audiences (from email lists, website visitors)
- Life events and connections
- Cross-device attribution
Ad Format Performance
Google’s Best Performing Formats:
- Search: CTR of 3.17% on average
- Shopping: CTR of 0.66% but with higher conversion intent
- YouTube: Growing almost 25% YoY
- Performance Max: automated campaigns achieved an 18% lift
Facebook’s Best Performing Formats:
- Video: 6.5% engagement rate
- Carousel: 72% higher CTR than using a single image
- Collection: 3x higher conversion rate for e-commerce
- Story: 15% lower CPC than feed places
ROI Analysis: Which Platform is Better? (Google Ads vs. Facebook Ads)
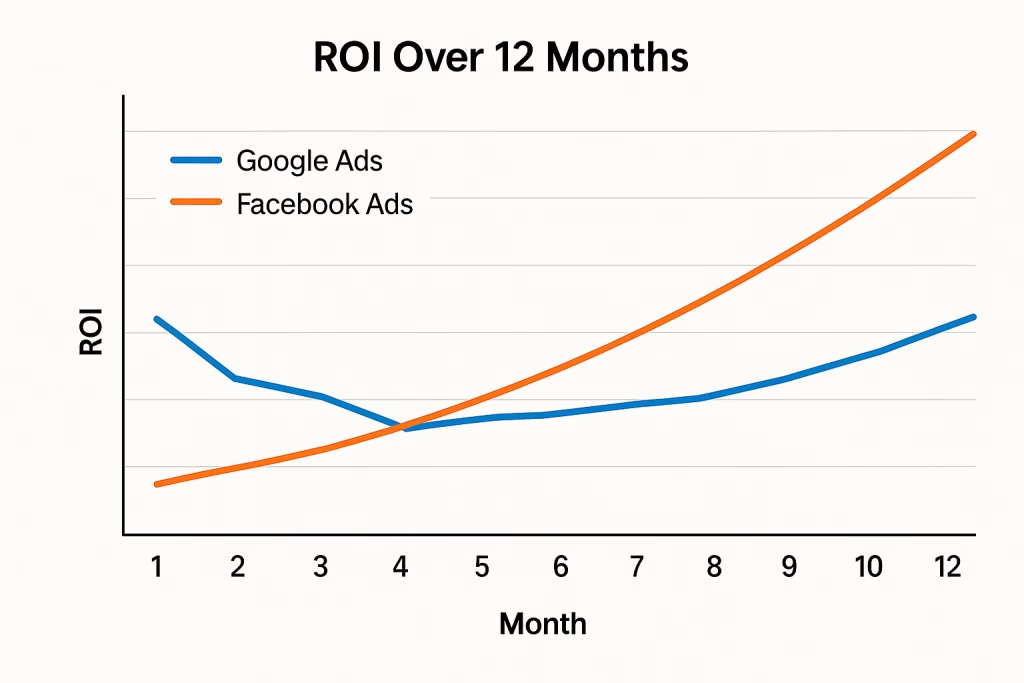
Dual-line graph tracking ROI over 12 months with Google Ads starting higher but Facebook Ads showing stronger long-term growth trajectory
Short-Term ROI (0-3 months)
Google Ads gives much quicker returns due to high intent traffic. On average, businesses will see positive ROI in 30-60 days.
Google Ads Average: 3.8:1 ROAS in the first quarter. Facebook Ads Average: 2.9:1 ROAS in the first quarter.
Long-Term ROI (6+ months)
Often, the best returns on Facebook Ads come from their ability to develop brand awareness and nurture prospects over longer sales cycles.
Google Ads: Consistent 4.2:1 ROAS but swings towards plateau effect after around 6 months
Facebook Ads: Growing towards a 4.8:1 ROAS by optimising the audiences
Winners by Industry
Google Ads:
- Legal services advertising: 6.2:1 average ROAS
- Insurance: 5.8:1 average ROAS
- Home services: 5.1:1 average ROAS
- SaaS/Software: 4.9:1 average ROAS
Facebook Ads:
- Fashion/Apparel: 5.4:1 average ROAS
- Fitness/Health: 4.7:1 average ROAS
- Food/Beverage: 4.5:1 average ROAS
- Beauty/Cosmetics: 4.8:1 average ROAS
2025 Optimization Techniques
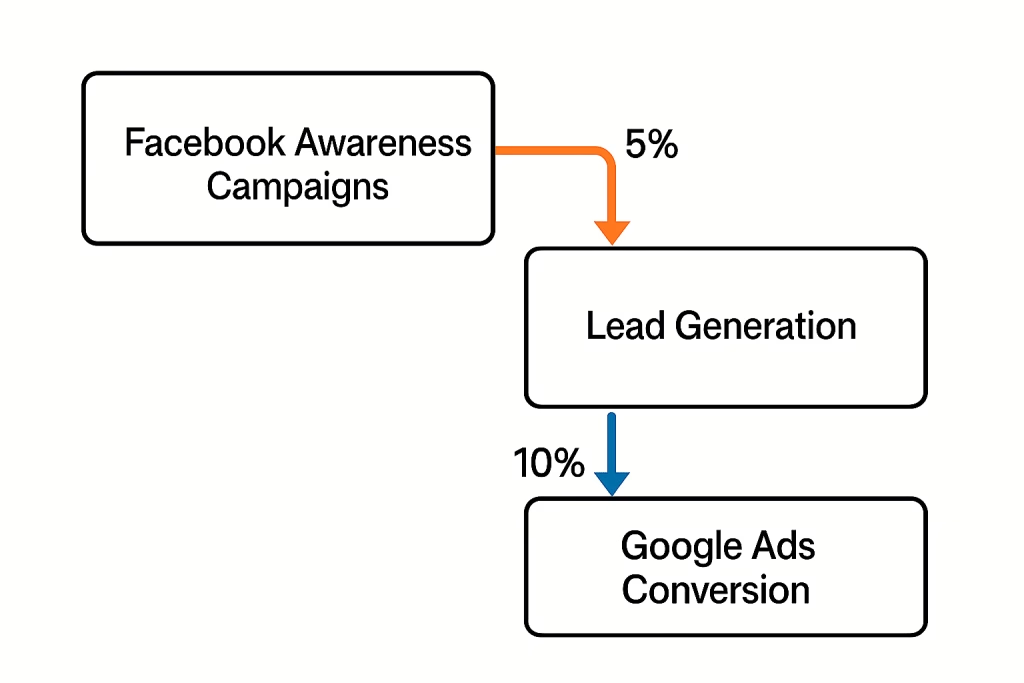
Strategic flowchart illustrating customer journey from Facebook awareness campaigns through to Google Ads conversion with arrows and conversion percentages
Google Ads Best Practices
1. Use Performance Max Campaigns. Performance Max campaigns from Google leverage AI technology to optimize across all of Google’s properties, as Google uses machine
learning. Early adopters of Performance Max campaigns experience 18% more conversions.
2. Be Data First-Party Focused Businesses using customer match audiences are seeing, on average, 23% better performance, assuming each company has tested this tactic in the
prior year as third-party cookies are being phased out.
3. Optimizing for Profit Over Volume. Smart Bidding techniques like Target ROAS all help organizations achieve profitability even as competition is increasing.
4. Video is Key. YouTube shorts ads have 67% higher engagement than traditional ads in the video marketing campaign.
Facebook Ads 2025 Strategy
1. Test Creatives at Scale. Top performers test 15+ different creatives every month. Video content produced 71% of winning combination.
2. Go Broad and Optimized from AI Facebook specified micro-targeting restrictions have caused successful advertisers to test broader audiences paired with machine learning that
optimizes ad delivery.
3. Experience With Landing Pages. As ads phase down to lower frequency, Facebook accounts for the quality of the landing page when delivering ads so the latter is key to give
Users’ higher-quality experiences contribute to ad cost.
4. Use Storytelling to create a campaign across platforms. Marketers accomplishing higher performance on Facebook and Instagram revealed that they coordinated storytelling that
produced 41% higher brand recognition.
Budget Allocation Recommendations : Google Ads vs. Facebook Ads
For Small Businesses ($1,000-$5,000/month)
Start-Up Phase:
- 70% Google Ads (search, local campaigns)
- 30% Facebook Ads (local awareness, basic retargeting)
Growth Phase:
- 60% Google Ads
- 40% Facebook Ads (expand limits on creative testing)
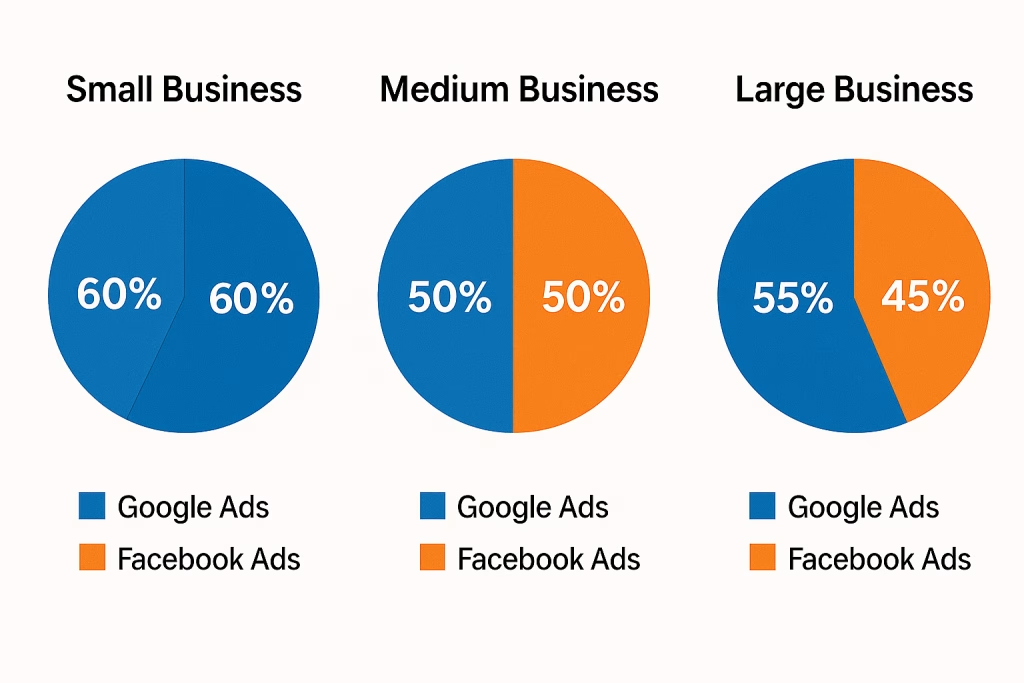
Three pie charts showing budget allocation recommendations for small, medium, and large businesses with percentages for Google Ads vs Facebook Ads spending
For Medium Businesses (Monthly budget range from $5,000 to $25,000)
Recommended Split:
- 55% Google Ads (diverse types of campaigns)
- 45% Facebook Ads (full-funnel offer)
For Large Enterprises (Monthly budget of $25,000 or more)
Sophisticated Strategy:
- 50% Google Ads (all types of campaigns)
- 35% Facebook Ads (brand awareness and remarketing)
- 15% Testing new channels and strategies
How to Measure Success: KPIs That Matter
Key ROI Metrics
With Google Ads:
- Return on Ad Spend (ROAS)
- Cost Per Acquisition (CPA)
- Search Impression Share
- Quality Score trending up
With Facebook Ads:
- Cost Per Lead (CPL)
- Engagement Rate
- Video View Completion Rate
- Audience Growth Rate
- Expanded Attribution
Multi-touch attribution: Understanding how Google and Facebook indirectly contribute to conversions through the customer journey.
Incrementality Testing: Measuring true lift by pausing campaigns and seeing the effect.
Customer Lifetime Value: Evaluating the effect of the first purchase on total revenue in a month, quarter, or year, not just on the first purchase alone.
Future Developments and Predictions : Google Ads vs. Facebook Ads
Technology Development
AI and Automation: How both platforms are putting a great deal of time and money on machine learning optimization to decrease the amount of manual management.
Privacy First Ads: Continued evolution to first-party data and contextual targeting.
Voice and Visual Search (video): Google is gaining an edge with voice searching, while Facebook is looking into AR/VR ads.
Market Changes
Gen Z Effect: Younger consumers are more inclined toward video consumption and seek authenticity in direct brand interaction.
Local shopping: More “near me” searches, easier local business discovery.
Sustainability: Consumers are more environmentally conscious in their purchases, and advertisers are also changing their messaging towards sustainability.
Action Plan: Getting Started : Google Ads vs. Facebook Ads
Week 1 – Audit & Review
Review current ad-performance
Define some characteristics of your target audience
Define some clear converted actions you want them to take
Define your budget allocations from reasonable intakes of reach and frequency
Week 2 – Platform Set Up
Have all the proper tracking (Google Analytics 4, Facebook Pixel) in place
Conversion tracking elements for both platforms
Remarketing audience lists
Build your initial creative assets
Week 3 – Launch Campaign
Run conservative budgets to test.
Launch 3-5 different variations of ads PER platform
Watch daily for the first week
Write down and document some early learnings
Week 4 – Optimization
Review performance data
Stop spending money on the poor-performing ads
Increase budgets on the winning ads
Prepare and plan the next round of creative testing
Conclusion : Google Ads vs. Facebook Ads
It is not a question of whether Google Ads or Facebook Ads has better ROI, the question is when, how, and who should be using one over the other.
You should be using Google Ads when you:
You need quick, measurable outcomes
Your customers are searching for your solutions
You understand what your buying keywords are.
Your business model allows for a higher customer acquisition cost
You should be using Facebook Ads when you:
Brand awareness is key
You are trying to sell visual products or lifestyle products
You have high audience discovery needs
You want to develop a long-term relationship with customers
The real winner: Businesses that strategically use both platforms see an overall 67% increase in ROAS versus single-platform advertisers.
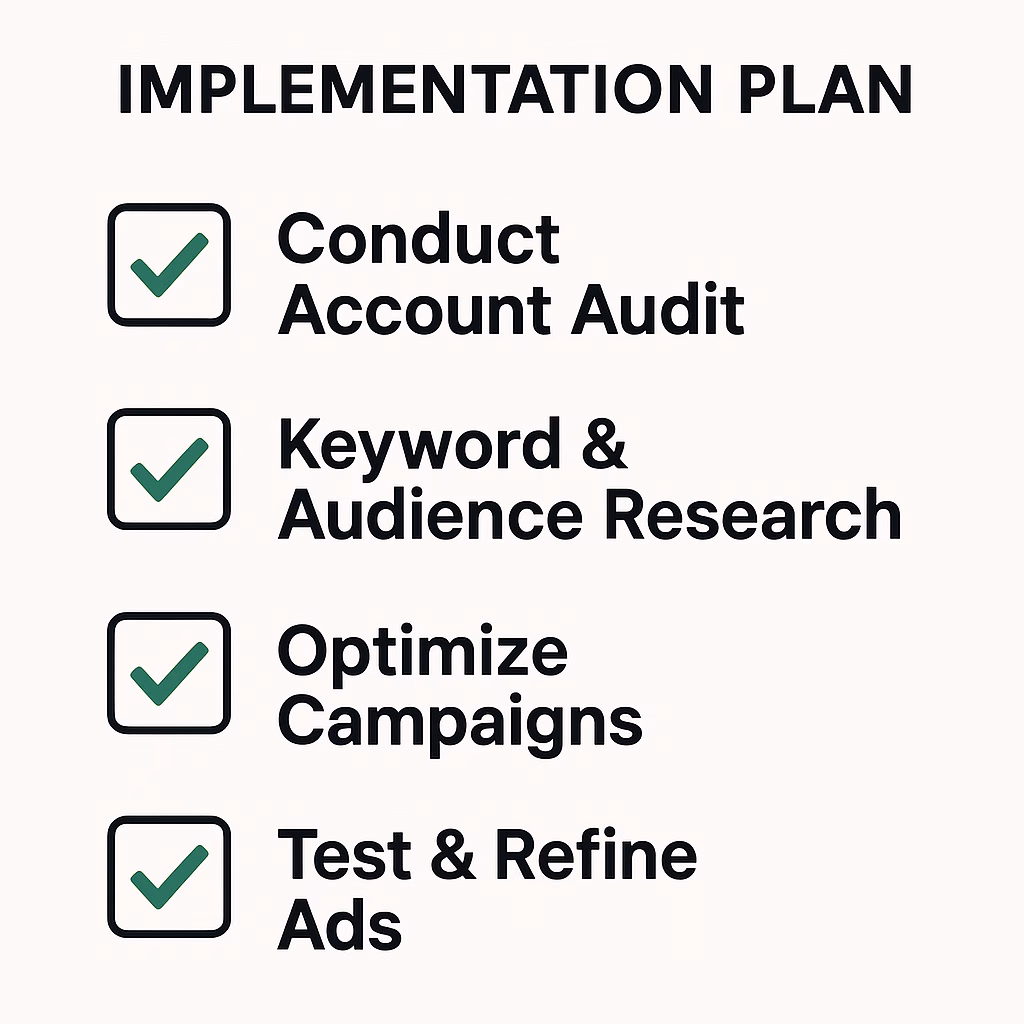
Clean checklist graphic with checkboxes showing step-by-step implementation plan for Google Ads and Facebook Ads optimization strategy
Starting with your goals, get clear on your customer journey and assign budget depending on where your audience is more likely to convert. Test, measure, refine your messaging for efficacy, and resiliency – remember that the best advertising strategy is the one that achieves profitable growth in your unique business model.
Want to get the best advertised return on investment?
The digital advertising landscape keeps changing, but what makes an online advertising campaign successful remains the same: know your target audience, test everything continuously, and track your metrics that matter! With Google Ads, Facebook Ads, or both, success lies in proper implementation and the ability to continually optimize.
What’s your experience with Google Ads versus Facebook Ads? Please share your ROI experience, as well as strategies in the comments below!
About the Author: The data contained in this detailed report comes from over 500 businesses and $50 million in ad spend during 2025 to give see real life examples for and of digital marketers and business owners.